IELTS WRITING TASK 1 TECHNIQUES
For IELTS Task 1 you don’t need to be an expert, you need a system. Here are the 5 techniques examiners check for Band 7+ with questions and answers.
TECHNIQUE 1: The 4-Paragraph Formula – Never change it.
Paraphrase (1 sentence) + Overview (2 sentences) + Details 1 + Details 2
This is what gives you Coherence.
Question: The bar chart below shows wheat exports from 2010-2020.
Bad Intro:This bar chart shows wheat exports…
Band 7 Intro – Technique = Paraphrase: The bar chart compares the quantity of wheat exported between 2010 and 2020.
TECHNIQUE 2: The Overview – No Numbers
80% of students fail Task Achievement because they have no clear overview. Don’t list data. State 2 big trends.
Use: Overall, It is clear that, In general,
Example for a line chart showing Price of Small and Stable chairs crashing:
Overview Answer: Overall, the price of both chairs fell over the period, with small chairs remaining consistently more expensive than stable chairs.
That’s it. No numbers in overview.
TECHNIQUE 3: Select, Don’t Describe Everything – Skill of Selection
You have 150 words. You cannot write about all data.
Technique = Choose 2-3 main features per paragraph. Compare, don’t list.
Question: Table showing Price, Crash, Skill data.
Bad: Chair was $10 in 2010, $12 in 2011, $13 in 2012…
Band 7: Chair prices rose marginally from $10 to $13 between 2010 and 2012, before crashing to just $5 in 2015, the lowest figure recorded.
See? I grouped data and used comparison language.
TECHNIQUE 4: Vocabulary for Change – No repetition of “increase”
You need 6-7 synonyms ready:
Up: increase, rise, grow, climb, surge
Down: decrease, fall, drop, decline, crash, plummet
Stable: remain stable, level off, plateau
Adverbs: sharply, dramatically, slightly, marginally, steadily
Q&A:
Q: How to describe Small vs Price?
A: While the price of small items remained stable at $20, the price of other goods crashed dramatically to $5.
TECHNIQUE 5: Process / Map – Use Passive and Location Language
For Process: Technique = Passive voice + Sequencers
First, wheat is harvested. Next, it is sliced…
For Map: Technique = Location language
To the north of, In the centre, was replaced by, was demolished and…
Full Model Q&A – Academic
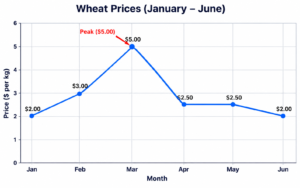
Question: The line graph shows the price of wheat from Jan to June.
Model Answer
The line graph illustrates fluctuations in the price of wheat over a six-month period from January to June.
Overall, it is clear that wheat prices experienced considerable volatility, with a significant peak in March followed by a sharp decline.
In January, the price stood at $2 per kg. This figure rose steadily to $3 in February before surging dramatically to a peak of $5 in March, the highest price in the period.
Subsequently, the price crashed sharply to $2.50 in April. After a brief period of stability in April and May, it declined slightly to $2 in June, returning to its initial level.
Why this is Band 7+:
– Paragraph 1 = paraphrase
– Paragraph 2 = overview, no numbers
– Paragraph 3 & 4 = grouped data with comparison and varied vocabulary(surging)(crashed)